
Cartesian Plane Generator: Printable Four-Quadrant Graphs for Functions & STEM
Learn how a Cartesian plane generator builds numbered X/Y axes, when to use a center origin vs Quadrant I, how to set cell size and numbering intervals, and how to print accurate four-quadrant graph paper.
Tip: Start from the Cartesian tool’s Center origin and 10mm cells for four-quadrant function practice; switch to Bottom-Left only when every value stays positive and you want the whole page for Quadrant I.
What a Cartesian plane generator actually prints
A Cartesian plane generator produces printable graph paper with a horizontal X-axis (abscissa), a vertical Y-axis (ordinate), and a numbered grid around their intersection — the origin (0,0). Unlike blank square graph paper, the axes and tick labels are part of the sheet, so you can plot points and sketch functions without drawing the coordinate system by hand.
On PrintableGrid, the Cartesian plane tool opens with a center origin for a full four-quadrant view. You can set grid cell size, independent X/Y numbering intervals, axis color, arrowheads, axis titles, paper size, and margins, then export PDF, PNG, or SVG. The grid is generated in the browser as vector-ready output, so printed lines stay sharp when you use Actual Size scaling.
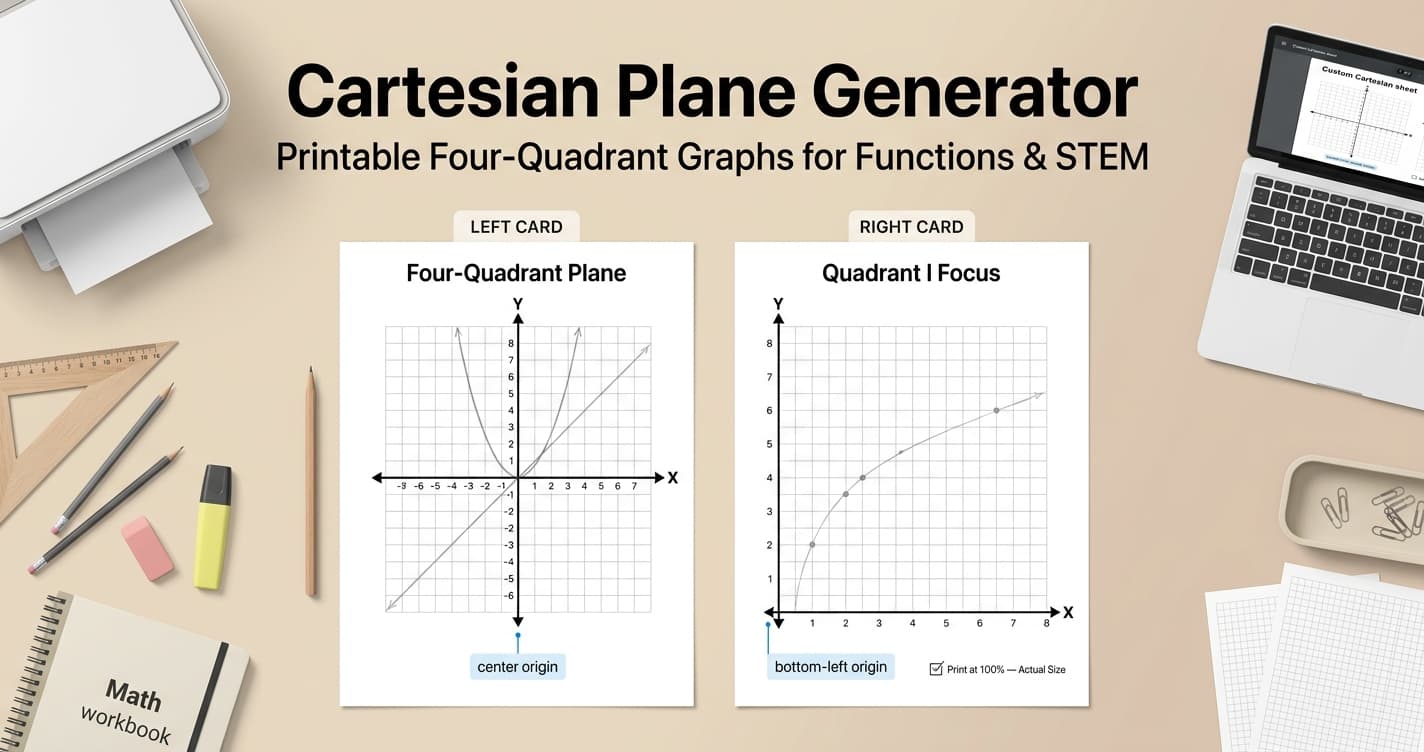
That combination — numbered axes plus a tunable square sub-grid — is what people usually want when they search for a Cartesian plane generator: homework-ready sheets for algebra, precalculus, physics sketches, and any diagram that needs signed coordinates.
Center origin, four quadrants, and when to switch
With the origin in the center of the page, all four quadrants are available: positive X/Y in Quadrant I, and signed values in II, III, and IV. That matches standard math-class convention for graphing linear, quadratic, and trigonometric functions that cross into negative territory.
The same tool also supports nine origin anchors. Keep Center for signed work. Switch to Bottom-Left when the data set stays positive and you want to maximize drawing area in Quadrant I — for example, simple distance–time tables or introductory plotting that never uses negative numbers. Edge and corner anchors (Top-Left, Center-Left, Bottom-Center, and the rest) help when one axis needs more room than the other.
Axis display options let you show or hide the axes, arrowheads, and axis titles, and pick an axis color separate from the background grid. A common textbook look uses light gray grid lines with heavier black axes (for example, about 0.5mm axes over a thinner sub-grid) so the coordinate frame reads clearly on paper.
Grid cell size and axis numbering intervals
Grid cell size on this Cartesian generator runs from 1mm to 50mm in 0.5mm steps (or the inch equivalent), with a default of 10mm square cells and aspect ratio locked so squares stay square. The half-millimeter step matters when you need a scale that whole-millimeter grids cannot hit — for example, 12.5mm per unit.
Numbering interval defaults to 1 on both axes and can be set independently from 1 to 20. Counting by 1s suits compact function domains; raise the interval when labels start to crowd, or when each printed square should represent 2, 5, or 10 units on one axis. If your data spans a wider numeric range than the labels allow, increase cell size rather than forcing an interval beyond 20.
You can also tune number placement and font size (within the tool’s font range) so labels stay readable after printing. Preview on screen first: overlapping ticks are easier to fix before you export a full lesson set.
Cartesian plane vs coordinate plane generator
PrintableGrid offers two related tools that share the same axis engine but open with different default setups. The Cartesian plane generator defaults to a Center origin, numbering steps of 1 (up to 20), and 0.5mm grid increments — settings aimed at four-quadrant function work and technical sketches.
The general Coordinate Plane generator defaults to a Bottom-Left origin for mostly Quadrant I layouts and allows numbering intervals up to 50. Use that tool for positive-only homework and quick data plots; switch to the Cartesian plane generator when the lesson expects a centered, four-quadrant sheet from the first print.
Neither tool replaces a full graphing calculator: they print the blank, accurately scaled plane you plot on by hand. Plain square graph paper without numbered axes is a third option when you only need a grid and will draw axes yourself.
STEM and lesson uses
Algebra and precalculus: graph lines, parabolas, absolute-value V shapes, and basic trig curves on a consistent four-quadrant background. Print several sheets with the same cell size so successive problems stay comparable.
Physics and engineering: sketch velocity–time graphs, force diagrams, and simple vector components where signed axes matter. Heavier axis strokes and visible arrowheads help distinguish the coordinate frame from construction lines.
Data and drafting: manual scatter plots, scale drawings, and layout sketches that need a precise XY reference. Export PNG when you want a background layer in a digital notebook; keep PDF for stacks of identical worksheets.
How to print a Cartesian plane at true scale
Cell size and numbering only stay meaningful if the PDF prints at Actual Size (100%). Fit to Page or Shrink to Fit scales the whole plane, so a 10mm square no longer measures 10mm and axis labels drift relative to your ruler checks.
Margins on this tool default to 15mm — a bit more room than plain graph paper — so axis titles and edge numbers are less likely to clip. You can adjust margins within the allowed range and center the grid on the page. Pick A4 or Letter before you lock cell size, because printable width changes how many units fit on each side of the origin.
Print one test sheet and measure a few grid squares with a ruler. If the measurement does not match the generator setting, fix the print dialog scale before you run a class set. For digital annotation apps, export PNG with a light grid color so ink or stylus marks stay readable on top.
Generate a printable Cartesian plane
Set center or corner origin, 0.5mm-step cell size, independent X/Y numbering (1–20), and axis styling, then export PDF, PNG, or SVG.
Open Cartesian Plane Generator